Lucentt
Custom Software Realises Productivity Gains
We’ve designed and built a custom web app to show at a glance Lucentt’s manufacturing successes and rejects. Faults during manufacturing are inevitable, however, business owner Bruce Reid wanted a visual, digital software that would visualise the faults occurring on a daily basis, with a view to be able to identify trends and provide insights on common mistakes made. With this insight, further training and systems improvements can be implemented.
“We cannot accept that we don’t know why an item was rejected,” says Matt Fridh, Production Manager at Lucentt. Ultimately, with operational insights, Lucentt believes that the rate of rejects generated in manufacturing can be reduced to a minimum.

For Version 1, this has been a home run.
Matt Fridh – Production Manager, Lucentt
Background
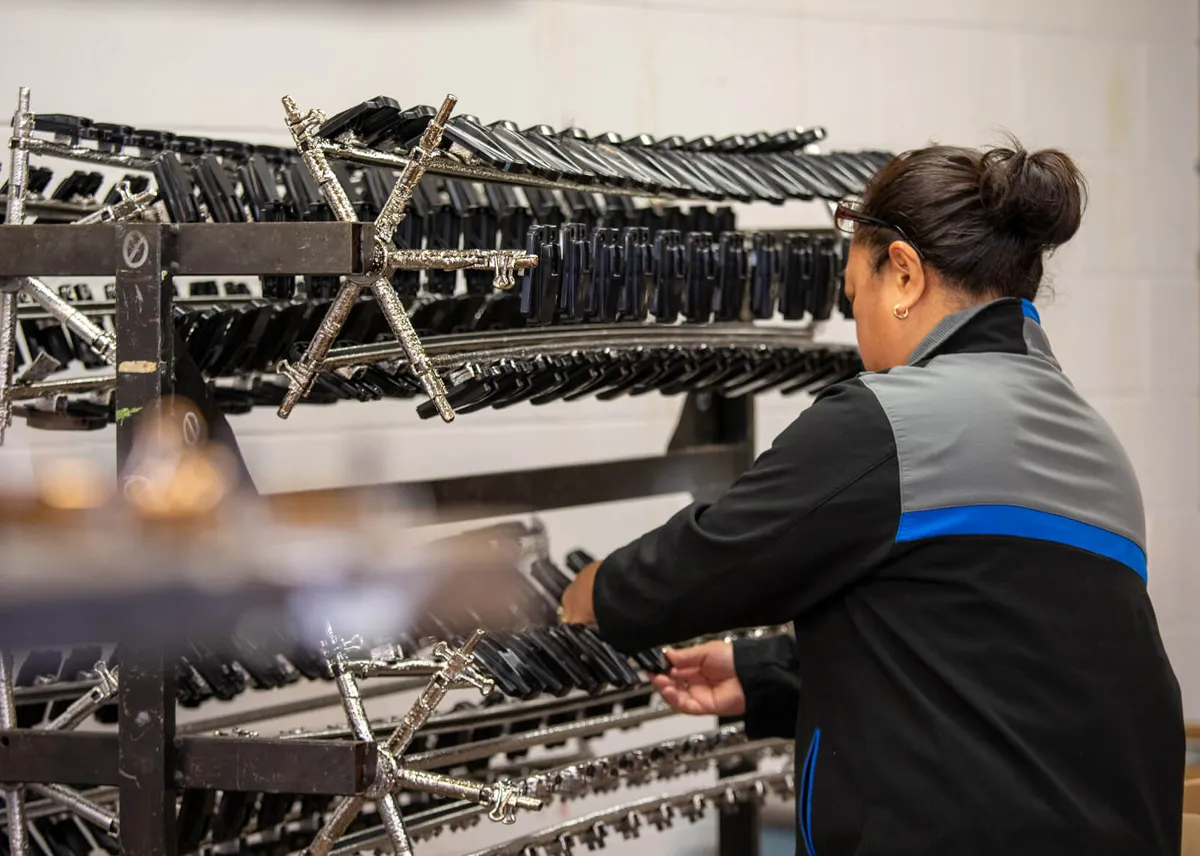
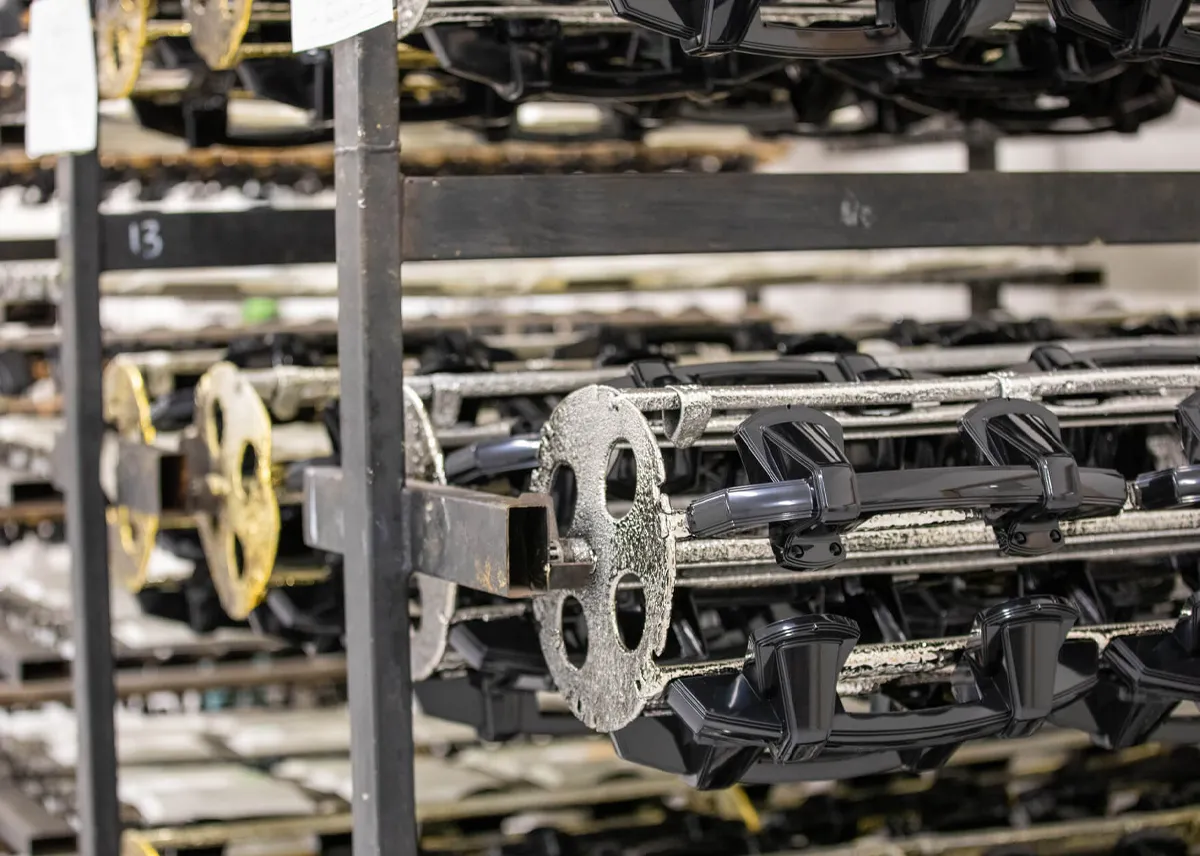
Lucentt is New Zealand’s largest manufacturer and distributor of specialist equipment and resources to funeral homes across the shaky isles. A key part of their Auckland-based manufacturing operation is creating a vast range of coffin handles and ornamentation. Just like the badge on your car, these components are moulded in plastic, then vacuum metalised to give these items a metallic finish.
The Project
The Problem
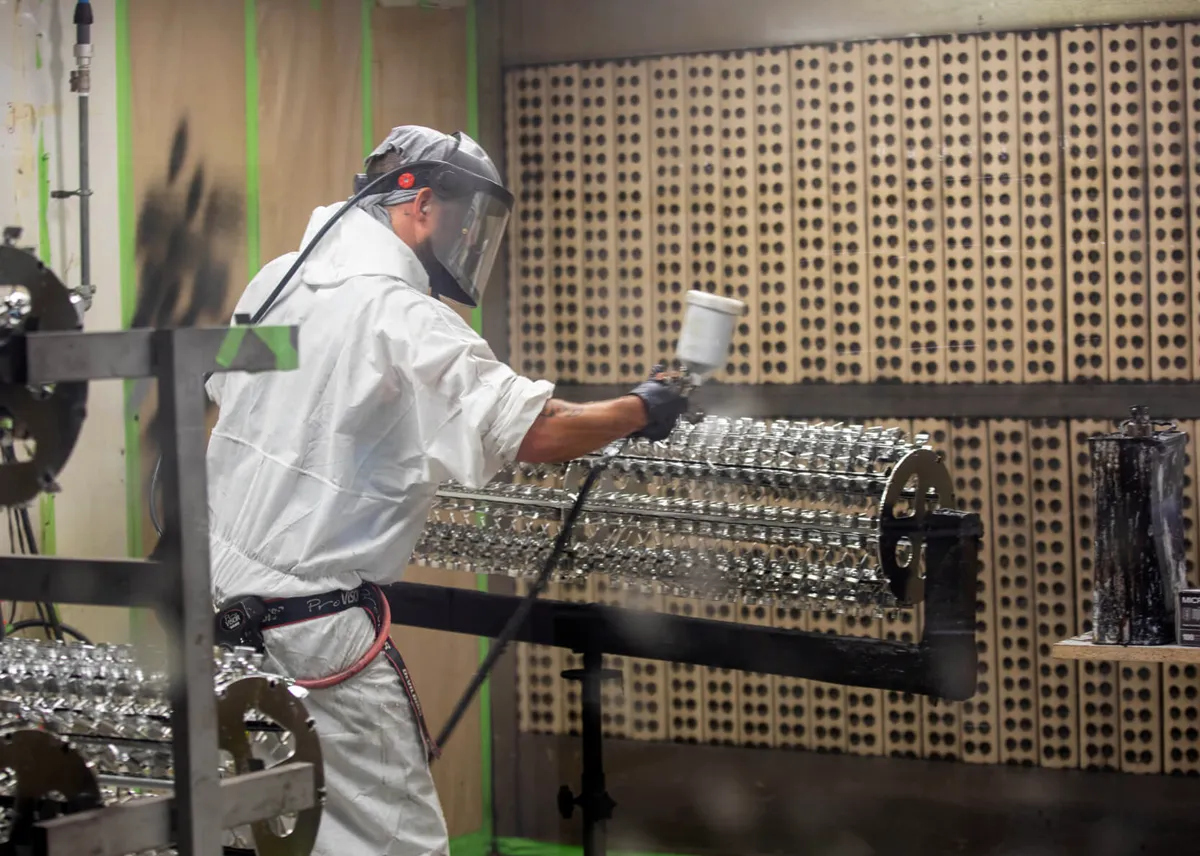
Lucentt manufactures units in the thousands on a daily basis. The process requires exacting standards, care and attention to detail in order to produce a blemish-free end product. Lucentt have identified a baker’s dozen of potential faults that can occur during manufacturing that impact on the number of units entering production versus the number of products successfully made, packaged and shipped out to their customers around New Zealand.
The Ask
“I just want a real simple visual display, like a speedo,” said Bruce.
Initially, together we researched various production softwares out there and came across literally hundreds of apps that were too advanced and yet too generic – and in the vast ocean of softwares available on the world wide web – too numerous to identify a “simple” solution to meet Bruce’s needs.
So the creative minds at Hart Design set about designing our own custom web app, built specifically for Lucentt’s needs.
How It Works
Daily, in a spreadsheet, Lucentt records details of products manufactured, the number of occurrences of various faults, among other information. Saved as a CSV file, they upload the data into the custom web application, where our ingenious script takes over…
Our script:
- Imports the CSV data into a mySQL database – a fundamental building block for everything that happens thereafter;
- The numbers are crunched;
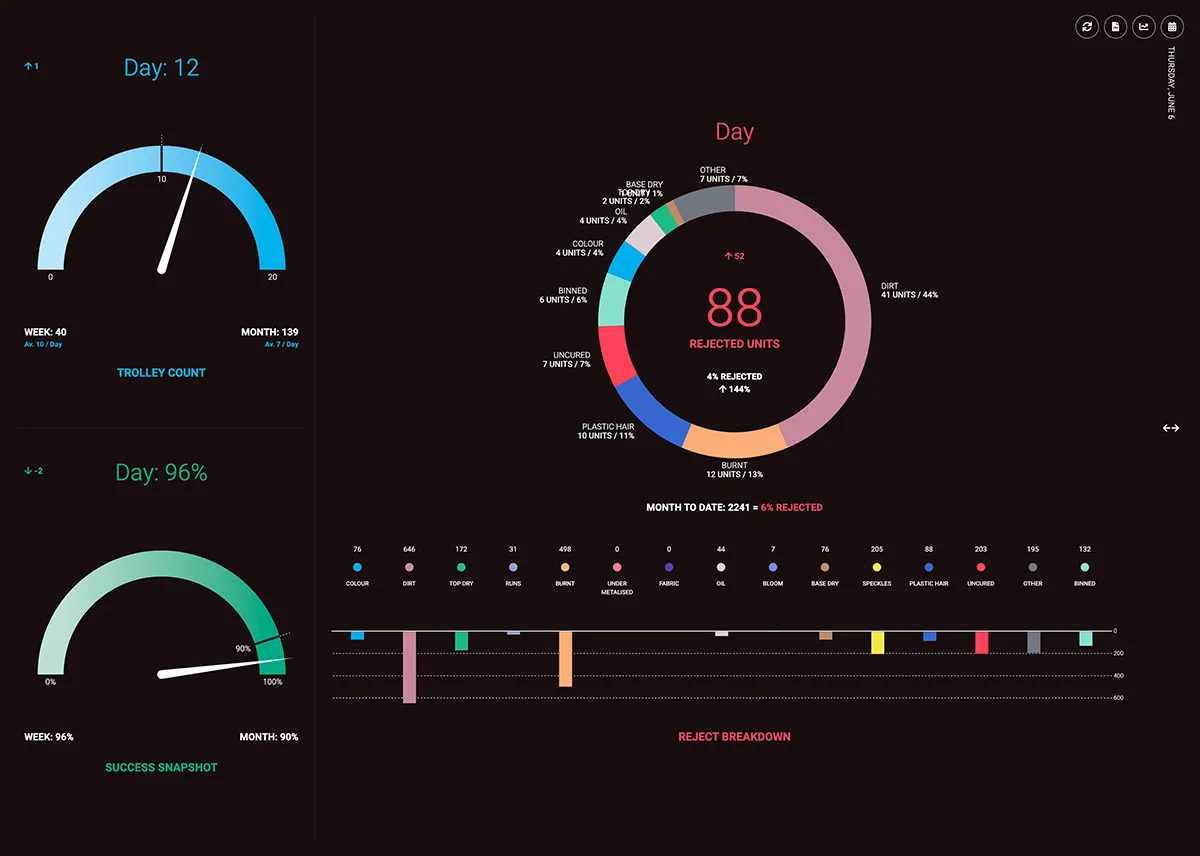
- Then the results are displayed as a series of graphs on a web page hosted on our web server, and available to Lucentt anywhere with an internet connection.
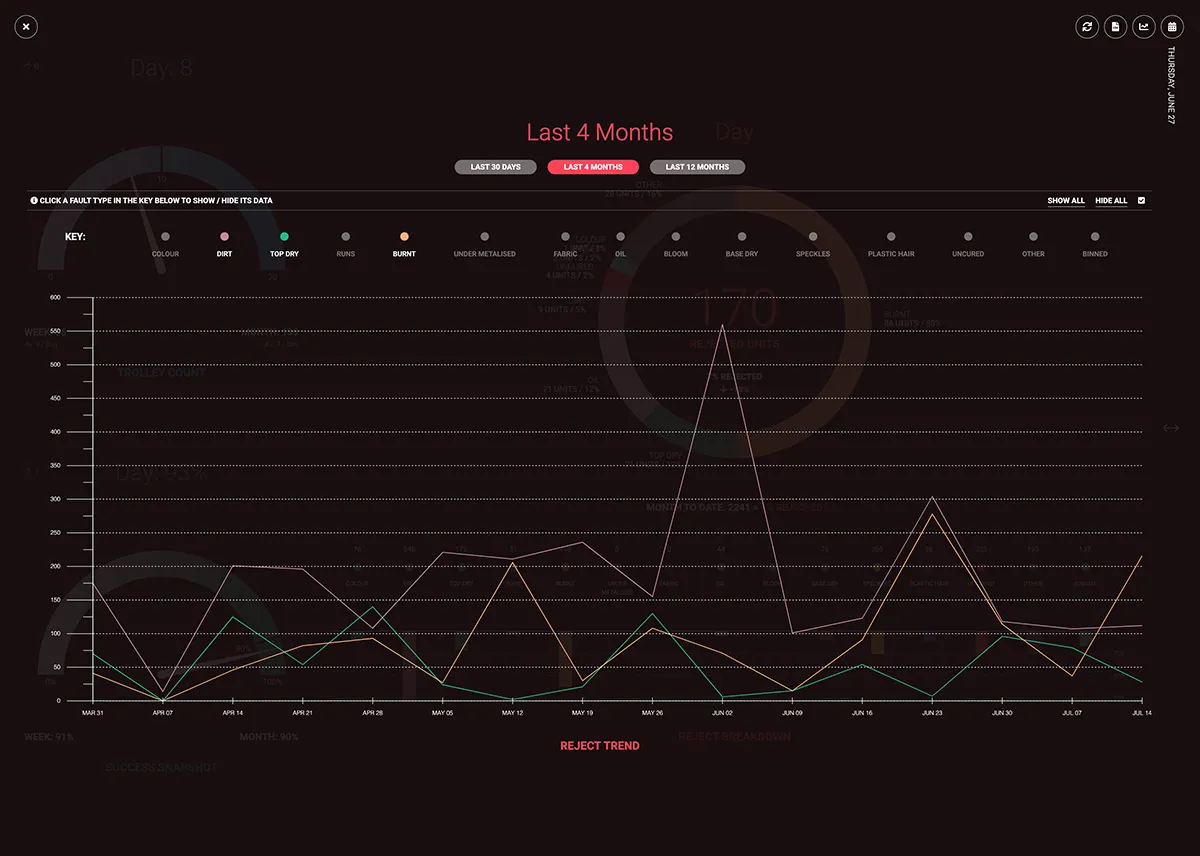
Lucentt casts the page to a large monitor on the shop floor so that the team can see and celebrate their successes, while users with direct access to the web app have the ability to drill deeper into the data to analyse trends, gain insight into potential causes and plan constructive responses to issues.
Custom Web App
The Result
“For Version 1, this has been a home run,” says Production Manager, Matt Fridh.
Matt was routinely recording production stats in a spreadsheet already. The data was always there in a large, highly detailed spreadsheet, but until now there was no way to quickly visualise the successes and failures of their manufacturing operation. With the development of this custom web app, Lucentt can see at a glance whether they’re hitting or missing KPIs on the shop floor.
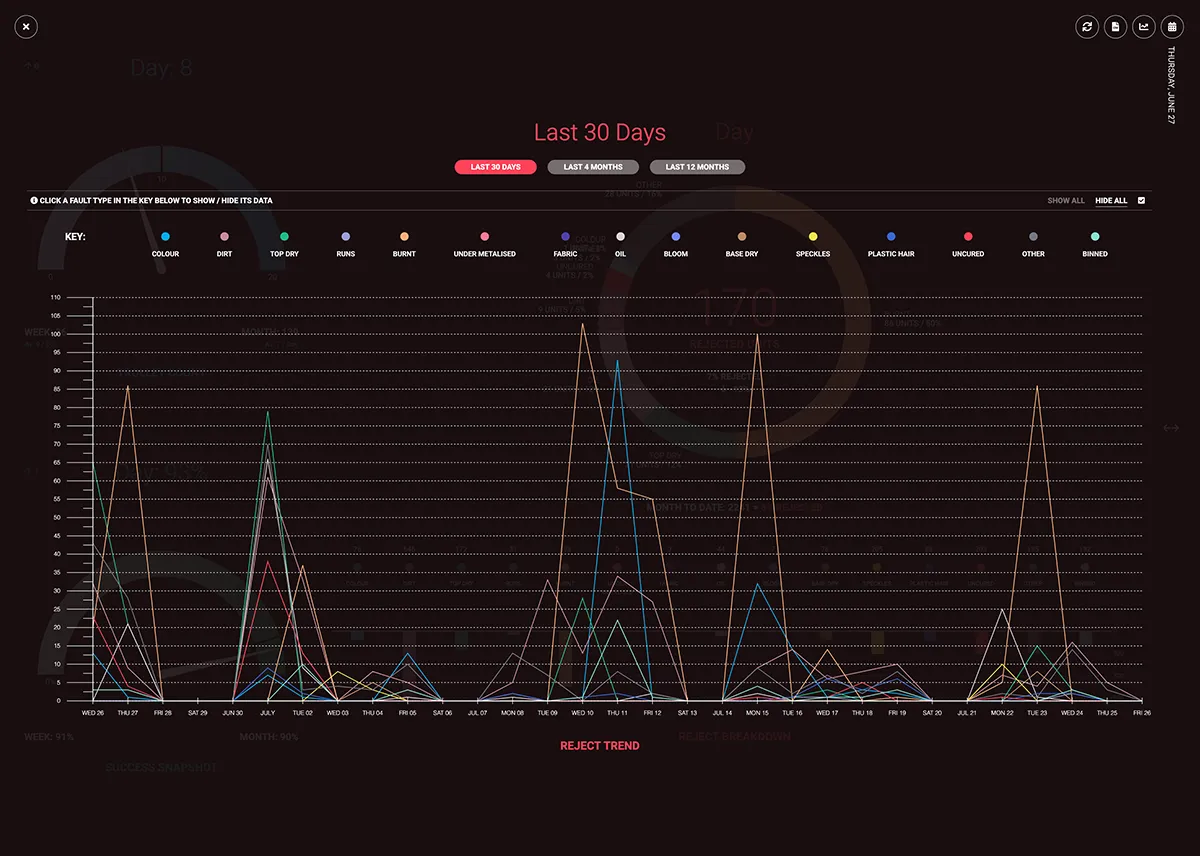
The insights provided very quickly uncovered two different trends where particular faults were recurring. The individual fault types were once thought to be exclusively caused by human error, however, investigations into the trends visualised by our web app ultimately led to two valuable discoveries.
With this new knowledge acquired, the team could adjust their production environment and in doing so they have virtually eliminated these once-common fault types. This has resulted in a practically immediate return on investment for this custom web software.
In the first trend, faulty items were speckled with dust, causing imperfections in the finish. In a workshop environment, some dust is to be expected, however, the visualised data revealed an unacceptably high recurrence of the issue. The initial assumption was that this spike in speckled units was caused by an unclean working environment, and improper application of the airbrush, designed to remove dust before finishing. A deeper investigation revealed that the dust was coming from the cardboard boxes in which the units were being stored prior to being finished. In contemporary plastics, often there is a portion of rubber in its composition to make the material more elastic. This has meant the plastic is more highly susceptible to static electricity, which was attracting the cardboard dust to the plastic units. The airbrush proved to be ineffective in removing the dust. The fix was simple and incurred virtually zero cost: wiping the units with a microfibre cloth before finishing has all but eliminated this fault type.
Secondly, Lucentt was puzzled by uneven colouring across particular batches. Rather than human error, in this investigation, Lucentt learned that the fault trend was in fact caused by a design flaw in the oven used to cure batches of product. The back of the oven was open at the top and bottom, causing uneven temperatures to impact colour consistency for certain colours. Again, the fix –altering the oven– was simple, cost effective, and provided a permanent solution to the problem of the once-high levels of colour inconsistencies.
Sometimes, rejecting a unit or batch of units is a subjective call. Sudden, unexpected spikes in rejects as visualised in the app can highlight if an inspector is being overly critical in their assessment of units. This insight allows managers to intervene, offering a second opinion on faults and providing further training to staff to improve the team’s quality control process.
Additionally, creating a minimalist, graph-based visualisation of successes v rejects can help incentivise Lucentt’s team to continually strive for better, as they can see at a glance the team’s overall success rate for any given day. While management is interested in the number of rejects generated each day, rather than labelling this as a “Reject Chart”, we have instead labelled this as a “Success Snapshot” so as to be a positive and encouraging influence for Lucentt’s workforce.
Matt states that “This app has meant more accountability and also some creative solutions on the shop floor that help prevent faults before units get pushed through the entire production process.” Once focussed on production volume, the app has “helped staff to understand what’s truly important: quality over quantity,” continues Matt.
Why Consider A Custom Web App
The main benefit of building a custom web app for your business is that you get everything you need; nothing you don’t; and have the ability to further develop your ideas in future. (More on that below).
Inevitably, as you use any new software, you wish it would do something else, some other dataset to track or insight to harvest. With a custom web app, there’s no reliance on a SaaS (software as a service) company to build out the features you want. You’re in the driver’s seat, and the ability to expand upon your initial ideas is limited only by your imagination.
Speaking of SaaS, a key wish from Bruce Reid was that he did not want to be tied in to yet another subscription software for this project – a request virtually impossible to satisfy in today’s business environment, when looking to find something “off-the-shelf”. The only solution to this problem was to consider building our own custom software. Build it once, and then you’re looking at a minimal amount of maintenance (you should always seek to keep pace with ever-advancing technologies over time), and your ROI on a project like this is very quickly realised, as you have seen in the results outlined above.
What’s Next
Having experienced six months of using the software daily, enjoying many production insights acquired and improvements made along the way, Matt has identified new potential for our custom software.
Faults that occur during Lucentt’s manufacturing process do not necessarily mean the affected units are immediately binned. Many rejected units suffer faults that are only cosmetic in nature; they can be reprocessed and successfully recovered and eventually shipped, good as new.
We’re currently planning new development for this app that will track recovered units and tell important stories about the journey and ultimate redemption of initially rejected units. In short order, Lucentt will have even greater understanding of their production success rate and the gains achieved over time.
How could your business benefit from a custom web app?
Lucentt’s custom web app has inspired greater ownership over production across their workforce, and enabled management to be positive, proactive and agile in their response to production problems. ROI has been achieved rapidly, while new and exciting opportunities are in the works. Is there a business insight that you wish you had at your fingertips? Our team thrives on taking your vision and crafting custom software to meet your goals. We’d love to hear your ideas.